

Market Recap: November and December 2025
Financial Markets
US Stock Market
The stock market dipped during the first half of November but recovered and closed the month essentially unchanged (+0.13% MoM for the S&P500). December was essentially flat, with a slight dip around the 17th of December, followed by a recovery until the end of the year. In December, the S&P500 gained just 0.2%, while the NASDAQ 100 fell 0.7%. The small cap index (Russel 2000) followed identical trends. All major indices are hovering around all-time-highs, and losing momentum – are we seeing a distribution phase? Trading volumes in 2025 were slightly higher than a few years ago, indicating a lot of enthusiasm and activity in the US stock market.
COMMODITIES
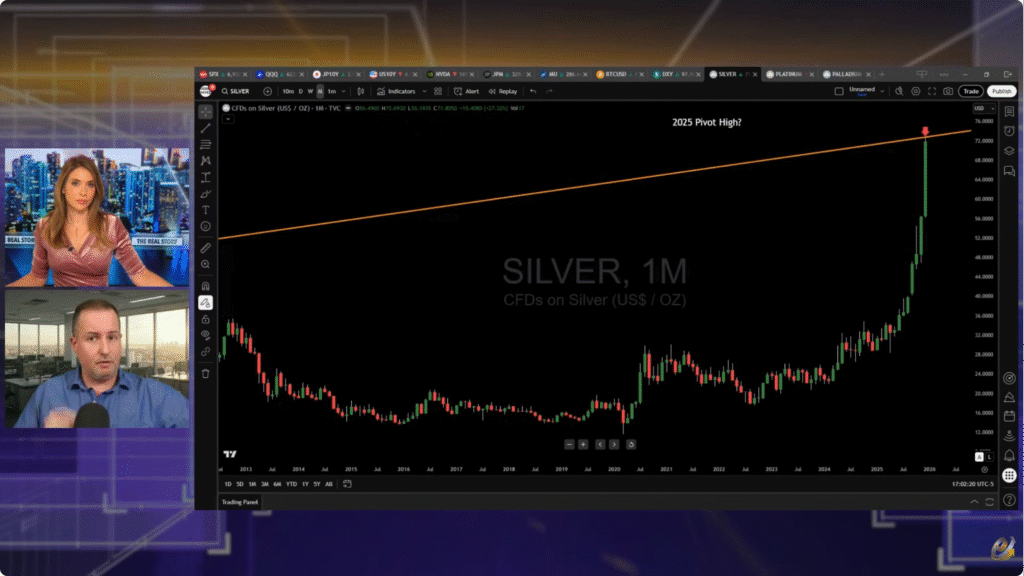
Precious metals continued climbing. Gold gained 5.4% and 2.4% in November and December, respectively. Silver was one of the biggest stars of the year, rising 15.9% and 27% in November and December, respectively. Will silver hold current levels? Probably not… 70$/oz and 67$ should be the next support levels.
WTI crude oil fell 3.9% and 1.8% in November and December, respectively. In early 2026 we are sitting at ~57$/bbl. In the short term, if oil continues falling, 55$ and 50$ should be support.
Bitcoin’s all time highs were clearly rejected, and it lost 17.5% and 3.2% in November and December, respectively. If bitcoin falls more, 83k$ and 74k$ should act as supports for the cryptocurrency.
US DOLLAR, MONEY SUPPLY
The relative strength of the US dollar (DXY) fell 0.2% and 1.2% in November and December, respectively. The DXY sits at ~98. The EUR/USD is around 1.172$, the GBP/USD is at 1.346$, and the USD/JPY is at 156.81 JPY. Overall, the USD and the JPY lost strength.
US M2 money supply at the date of 30th November 2025 was up by 0.11% relative to the previous data release, showing a continuous increase in the money supply since December 2023. Banks didn’t stop lending so far – if the money supply was going down, it would be a warning sign for the economy and equities.
The national financial conditions index (NFCI) released on 26th December 2025 loosened by 1.8% relative to the previous weekly release, continuing on a loosening trend. Note that this indicator is delayed by two weeks. Positive numbers in the NFCI mean tighter financial conditions, while negative numbers indicate looser financial conditions.
BONDS AND OPTIONS
US 10-year yields fell during November and increased in December. The longer end of the curve increased more, while the shorter end has decreased slightly due to FED rate cuts Yields now sit at 3.475% for the 2-year and 4.195% for the 10-year. The yield curve has uninverted since a year ago, an expression of expectations for low growth, low inflation, and short-term interest rate cuts. Long-term growth and inflation expectations are at ~4.871% (30-year US bonds).
The VIX jumped momentarily to ~18 in November and December, but it has since returned to very low levels of 14.5 at the beginning of the new year 2026. There is no fear in this market and nobody is buying protective options. The market is still very expensive and option sellers need to remain patient and selective regarding which contracts to sell. Selling puts on the overall market seems to be a losing strategy at this moment – the depths of a correction and fear spikes are the right moments to sell premium!
Comment Section
November was still marked by the US federal government shutdown (October 1, 2025 to November 12, 2025), which delayed the release of key economic data. In the December FED meeting, the FED president said that the jobs numbers were not to be trusted and their estimates were of negative revisions, indicating a contracting job market in the US. Federal Reserve staff believe the government’s payroll figures could be too high — by as much as roughly 60000 jobs per month. If that is true, the actual job gains could be much smaller than reported — and in fact the U.S. might be losing jobs on net, not adding them. This bearishness prompts for some more rate cuts in 2026, because inflation risks seem low compared to the unemployment risks. Also important: the FED ended quantitative tightening (QT), which is the process by which a central bank shrinks its balance sheet by allowing securities to mature without reinvestment or by selling them, thereby draining reserves and tightening financial conditions without changing interest rate policy. This tightening had consequences elsewhere in the system, as we discuss below…
Now we turn our attention to private credit. Private credit refers to loans made by non-bank lenders (private debt funds, direct lenders, etc.) instead of traditional banks. It has grown very fast in recent years and now rivals bank lending in size. However, this rapid growth brings some risks and stress points, namely:
- Weak borrower fundamentals
A large share of private credit borrowers are struggling with negative free cash flow, meaning they don’t generate enough cash to cover interest and other costs without refinancing or cutting expenses. This proportion has risen materially in recent years. - Rising use of “PIK” and covenant waivers
Payment-in-kind interest (where interest gets added to the loan instead of paid in cash) is becoming more common, hiding true credit stress and postponing recognition of defaults. (privatedebtnews.org) - Growing bank exposure to private credit
Banks have significant credit lines and exposures tied to private credit vehicles. If private credit suffers losses, banks could face calls on those lines or need to mark down asset values. (privatedebtnews.org) - Regulator warnings about size and opacity
Global watchdogs, including the Financial Stability Board, have expressed concern that the sheer growth and lack of transparency of private credit could pose systemic stability risks if conditions deteriorate. (PYMNTS.com) - Liquidity mismatches
Many private credit funds operate semi-liquid structures (e.g., quarterly redemption) even while holding illiquid loans. If investors suddenly demand cash, these funds can’t easily sell assets to meet redemptions without fire-selling.
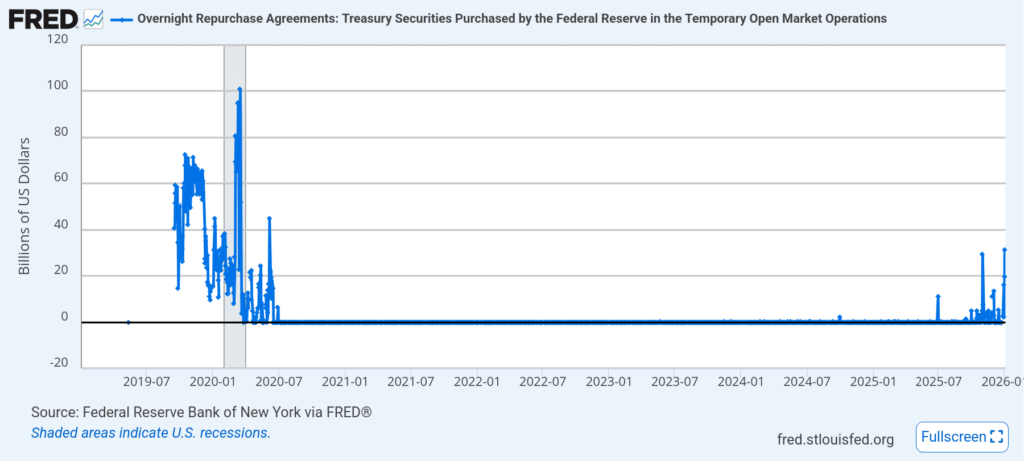
In short: credit quality is deteriorating under the surface, and many borrowers are stretched, leading to heightened concern that defaults and liquidity strains could accelerate if market conditions worsen. If we see the repo and reverse repo activity, there is something interesting going on. These are Fed’s short-term liquidity tools. Repo (repurchase agreements) are short-term loans where dealers (often banks or money funds) borrow cash against Treasury or agency collateral. Reverse repo (RRP) is the Fed borrowing cash from money market funds and others, offering Treasuries as collateral in return — effectively a liquidity absorber.
Let’s look at the most recent data:
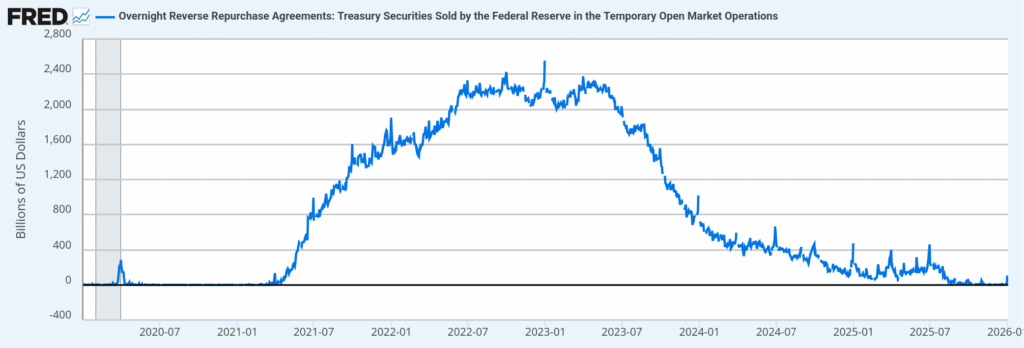
These tools are barometers for liquidity conditions:
High RRP usage in the past often signaled excess cash in the system looking for a safe home. This was the phase after COVID, marked by excess liquidity. However, towards the end of the year repo facility usage has spiked, to levels only seen amidst the liquidity crisis of 2019-2020. This should signal funding stress — institutions need cash that they can’t get easily from the private market. Elevated repo usage despite high interest rates suggests banks and dealers are struggling to find funding elsewhere.
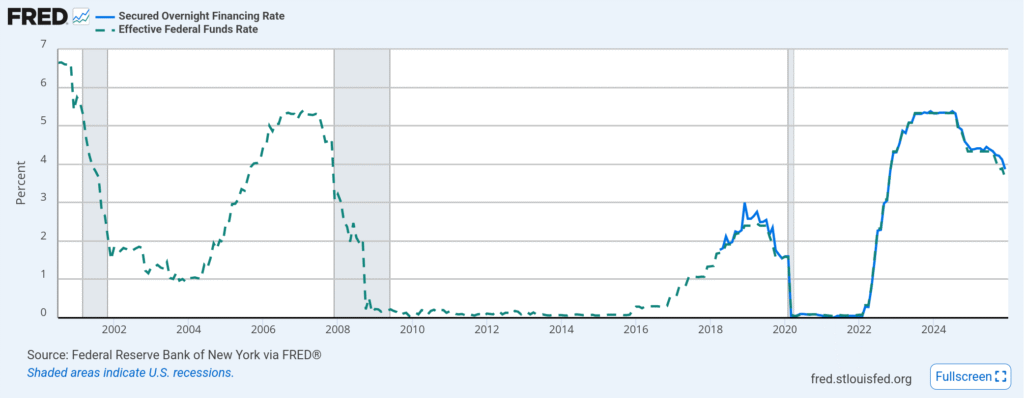
What happened in 2019 and before? Let’s turn our attention to the Effective Federal Funds Rate and the Secured Overnight Financing Rate:
An article from Wikipedia gives a quick explanation that serves as a primer for this subject (https://en.wikipedia.org/wiki/September_2019_events_in_the_U.S._repo_market):
“On September 17, 2019, interest rates on overnight repurchase agreements (or “repos”), which are short-term loans between financial institutions, experienced a sudden and unexpected spike. A measure of the interest rate on overnight repos in the United States, the Secured Overnight Financing Rate (SOFR), increased from 2.43 percent on September 16 to 5.25 percent on September 17. During the trading day, interest rates reached as high as 10 percent. The activity also affected the interest rates on unsecured loans between financial institutions, and the Effective Federal Funds Rate (EFFR), which serves as a measure for such interest rates, moved above its target range determined by the Federal Reserve.
This activity prompted an emergency intervention by the Federal Reserve Bank of New York, which injected $75 billion in liquidity into the repo markets on September 17 and continued to do so every morning for the rest of the week. On September 19, the Federal Reserve’s Federal Open Market Committee also lowered the interest paid on bank reserves. These actions were ultimately successful in calming the markets and, by September 20, rates had returned to a stable level. The Federal Reserve Bank of New York continued to regularly provide liquidity to the repo market until June 2020.
The causes of the rate spike were not immediately clear. Economists later identified its main cause to be a temporary shortage of cash available in the financial system, which was itself caused by two events taking place on September 16: the deadline for the payment of quarterly corporate taxes and the issuing of new Treasury securities. The effects of this temporary shortage were exacerbated by declining level of reserves in the banking system. Other contributing factors have been suggested by economists and observers.”
What is happening? We are entering the phase of decreasing short-term interest rates, and we are seeing evidence of liquidity issues. In the past, this moment has coincided with the beginning of a recession – see the shaded areas of the three previous recessions in the plots above. Extrapolating the past behavior of the financial system and economy, we should be (approximately) entering a recession, as lending ceases and unemployment increases. The central banks will push interest rates back to zero over 2026-2027 as a response, but more liquidity injections (QE or others) might be necessary is the system freezes. If history is a teacher, it is time to take some profits, sell a bit, hold some cash, and wait for the crash! Don’t be caught by lack of liquidity – cash is opportunity. Buckle up and happy 2026!
Recommended Videos
Video: HOLY SH*T: European Banking Data Confirms a Systemic Problem
Channel: Eurodollar University

Video: Top Trader Forecasts Gold & Silver for 2026 – and the Black Swan That Could Derail Markets
Channel: Miles Franklin Media
Video: Money Expert: You’ve (Likely) Been Playing The Game of Life Wrong
Channel: Veritasium