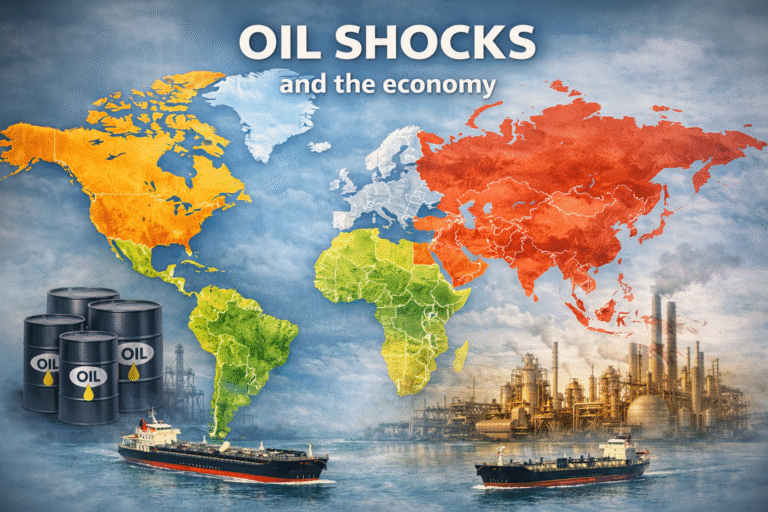
(And What It Means for Markets)
Oil prices have a habit of moving sharply whenever geopolitical tensions rise. Whether it’s wars in the Middle East, sanctions on major producers, or attacks on energy infrastructure, markets tend to react almost immediately.
But why does this happen—and why does it matter so much for the global economy and financial markets?
The Short Answer
Oil prices spike during geopolitical crises because markets fear disruptions to supply. Even the risk of disruption is often enough to push prices higher.
This reaction is amplified by the fact that oil is one of the most globally traded and strategically important commodities in the world.
1. Oil Is Highly Sensitive to Supply Shocks
The global oil market is tightly balanced between supply and demand. Small disruptions can have large price effects.
Geopolitical crises often occur in key producing regions—especially the Middle East, which accounts for a significant share of global oil output.
More importantly, critical transit routes like the Strait of Hormuz handle a large portion of global oil shipments. Any threat to these routes immediately raises concerns about supply shortages.
Recent conflicts highlight this dynamic clearly. In 2026, tensions involving Iran disrupted flows through the region, which carries roughly 20% of global oil supply, pushing prices sharply higher.
2. Markets Price in Risk—Not Just Reality
One of the most important (and often misunderstood) dynamics is that oil prices react not only to actual disruptions, but to expected risks.
Economists often describe two main channels:
- Supply risk channel: fear that future production or transport could be disrupted
- Uncertainty channel: geopolitical instability increases risk premiums in markets
Even before any physical supply is lost, traders begin pricing in the possibility of shortages, which pushes prices up.
This is why oil can spike within hours of geopolitical headlines.
3. Major Historical Oil Price Spikes (Geopolitics-Driven) – the Same Pattern
Oil markets have repeatedly reacted to geopolitical shocks.
3.1. The 1973 Oil Crisis
What happened:
- Arab members of OPEC imposed an oil embargo on the US and allies
- Trigger: support for Israel in the Yom Kippur War
Price impact:
- Oil prices quadrupled (~$3 → $12)
Market impact:
- Massive inflation surge
- Global recession
- Birth of modern energy geopolitics
Key insight:
Supply weaponization → structural, long-lasting shock
3.2. The 1979 Oil Shock
What happened:
- Iranian production collapsed during the Iranian Revolution
- Followed by the Iran–Iraq War
Price impact:
- Oil prices doubled again
Market impact:
- Stagflation (high inflation + low growth)
- Central banks forced into aggressive tightening
Key insight:
Actual supply loss → prolonged inflation shock
3.3. The Gulf War
What happened:
- Iraq invaded Kuwait
- Fear of disruption in the Persian Gulf
Price impact:
- Oil doubled in a few months
- Then dropped after military resolution
Market impact:
- Short-lived recession fears
- Quick normalization after supply stabilized
Key insight:
Fear-driven spike → sharp but temporary
3.4. The 2003 Iraq War
What happened:
- Anticipation of war disrupted expectations
- Not a huge immediate supply shock, but uncertainty surged
Price impact:
- Gradual increase, not a sharp spike
Market impact:
- Oil entered a multi-year bull market (2003–2008)
Key insight:
Geopolitics + strong demand = sustained trend
3.5. The Arab Spring
What happened:
- Political instability across oil-producing regions
- Libya supply disruptions
Price impact:
- Brent moved above $100
Market impact:
- Elevated inflation pressure
- Continued commodity supercycle
Key insight:
Regional instability → persistent risk premium
3.6. The Saudi Aramco drone attacks
What happened:
- Drone strike on Saudi oil facilities
- ~5% of global supply temporarily disrupted
Price impact:
- ~15% spike in a single day (one of the largest ever)
- Short-lived spike
- Rapid normalization after supply restored
Key insight:
Infrastructure shocks → sharp but short-lived moves
3.7. The Russian invasion of Ukraine
What happened:
- Sanctions on a major oil exporter (Russia)
- Massive uncertainty in global energy markets
Price impact:
- Oil surged above $120/barrel
Market impact:
- Global inflation spike
- Aggressive central bank tightening cycle
- Energy crisis in Europe
Key insight:
Large producer disruption → systemic macro impact
Supply vs Fear
- Actual supply disruption → long-lasting price increases
- 1973, 1979, 2022
- Fear/potential disruption → short-term spikes
- 1990, 2019
Geography Matters
Most major oil shocks originate from:
- Middle East
- Russia / Eurasia
Concentration of supply = structural vulnerability
Oil Shocks = Inflation Shocks
Almost every major oil spike led to:
- higher inflation
- central bank tightening
- slower growth
This is why oil is so central to macro.
Second-Round Effects Matter More
The initial spike is just the start.
What really matters:
- Do wages rise?
- Do central banks react?
- Does demand collapse?
This determines whether:
- it’s a temporary shock
- or a recession trigger
Markets React Asymmetrically
- Oil ↑ fast on bad news
- Oil ↓ slower when risk fades (because risk premium takes time to unwind)
Examples:
- The 1990 Gulf War caused oil prices to double within months due to fears of supply disruption
- The Russia–Ukraine war (2022) pushed oil above $120 per barrel as sanctions disrupted supply
- Attacks on major facilities (e.g. Saudi infrastructure in 2019) triggered some of the largest single-day price spikes in decades.
- More recently, escalating tensions in the Middle East have again driven prices above $100 per barrel and created significant volatility across energy markets.
4. Why Oil Price Spikes Matter for the Economy
Oil is a core input across the global economy. When prices rise, the effects ripple quickly.
Inflation Rises
Higher oil prices increase:
- transport costs
- manufacturing costs
- energy bills
These costs are passed on to consumers, contributing to inflation.
Growth Slows
Higher energy costs act like a tax on the economy:
- consumers spend less elsewhere
- companies face lower margins
In extreme cases, oil shocks have contributed to recessions (as in the 1970s).
Central Banks React
If inflation rises due to energy prices, central banks may:
- delay rate cuts
- keep interest rates higher
This creates additional pressure on financial markets.
5. Impact on Financial Markets
Oil shocks don’t stay confined to energy markets—they affect nearly all asset classes.
Stocks
- Some equities related to the energy sector may temporarily benefit from elevated oil and gas prices (energy stocks typically outperform).
- However, in the medium term, broad equity markets often fall due to:
- higher costs
- lower growth expectations
Bonds
- Inflation fears push yields higher
- Bond prices may fall
Currencies
- Oil-exporting countries benefit (stronger currencies)
- Oil-importing countries suffer (weaker currencies)
Volatility rises
Geopolitical events increase uncertainty, leading to:
- higher market volatility
- risk-off sentiment
7. The “Fear vs Reality” Dynamic
A key insight: not all oil spikes are equal.
- Short-term spikes are often driven by fear
- Sustained rallies usually require actual supply disruption
Markets tend to overshoot initially, then stabilize once the real impact becomes clearer.
8. What Investors Should Watch
To understand where oil prices may go next, focus on:
- Geopolitical hotspots (Middle East, Russia, major producers)
- Shipping routes (especially chokepoints like Hormuz)
- OPEC+ decisions (supply adjustments)
- Global demand trends (growth vs slowdown)
These factors determine whether a price spike is temporary—or something more structural.
Final Thoughts – Putting it All Together
Oil sits at the intersection of geopolitics and economics. That’s why it reacts so quickly—and so violently—to global events. When geopolitical tensions rise, oil prices often move first. And when oil moves, the rest of the market usually follows. Understanding this chain reaction is essential for anyone trying to make sense of macro trends—and anticipate where markets might go next.
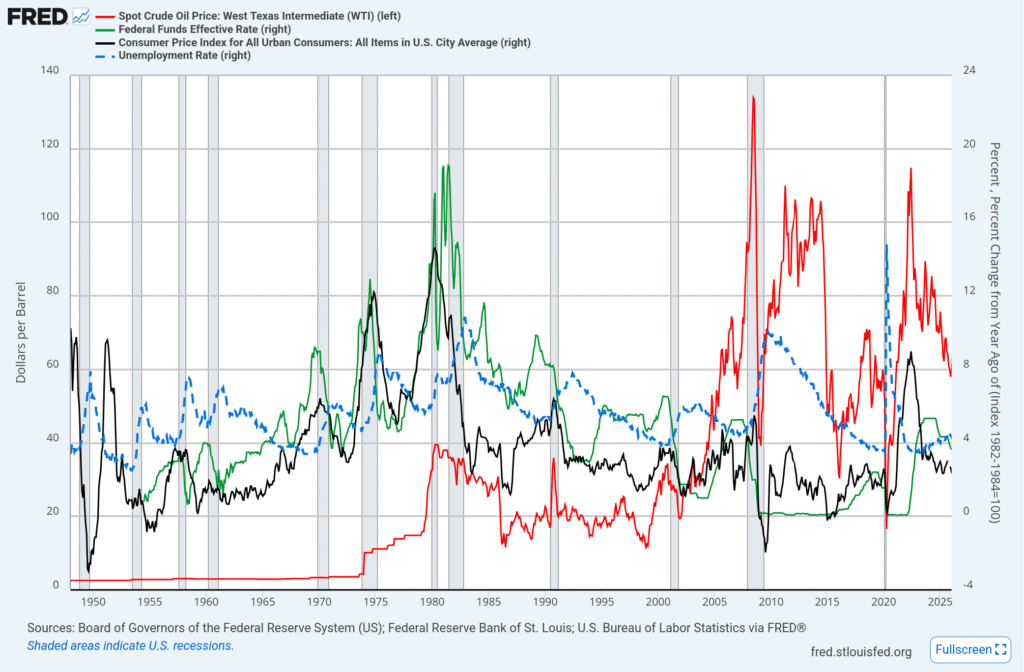
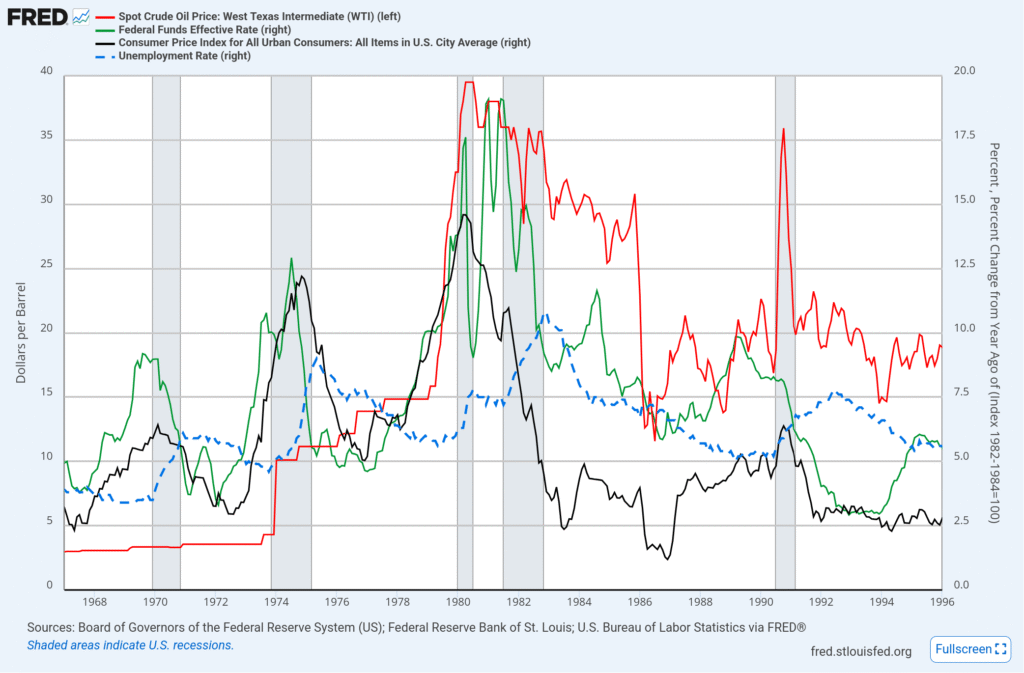
We have created a set of charts dating back to the 1950s, containing the oil price, the consumer price index (CPI), Federal funds rate and the unemployment rate.
Although each market cycle is different in terms of the FED timing and the exact catalyst that pushes markets into a downturn, we can clearly observe:
- Oil (red line) is highly correlated with the consumer price index change year-over-year, that is, the annualized inflation rate (black line)
- The FED funds rate is rising or has been higher than in the previous years right before a recession period (1956,1969,1973,1981,1989,2000, 2007, 2019, 2026)
- The rise in FED funds rate has an overlap with the rise in inflation (1976-1980) or a delay of a few months relative to the beginning of an inflation increase (eg. 2004, 2022)
- The unemployment rate is usually low before a recessionary period and takes a few months into a recession to meaningful increase (>1%). The unemployment rate is a lagging indicator, thus, it is just a confirmation of the recession.
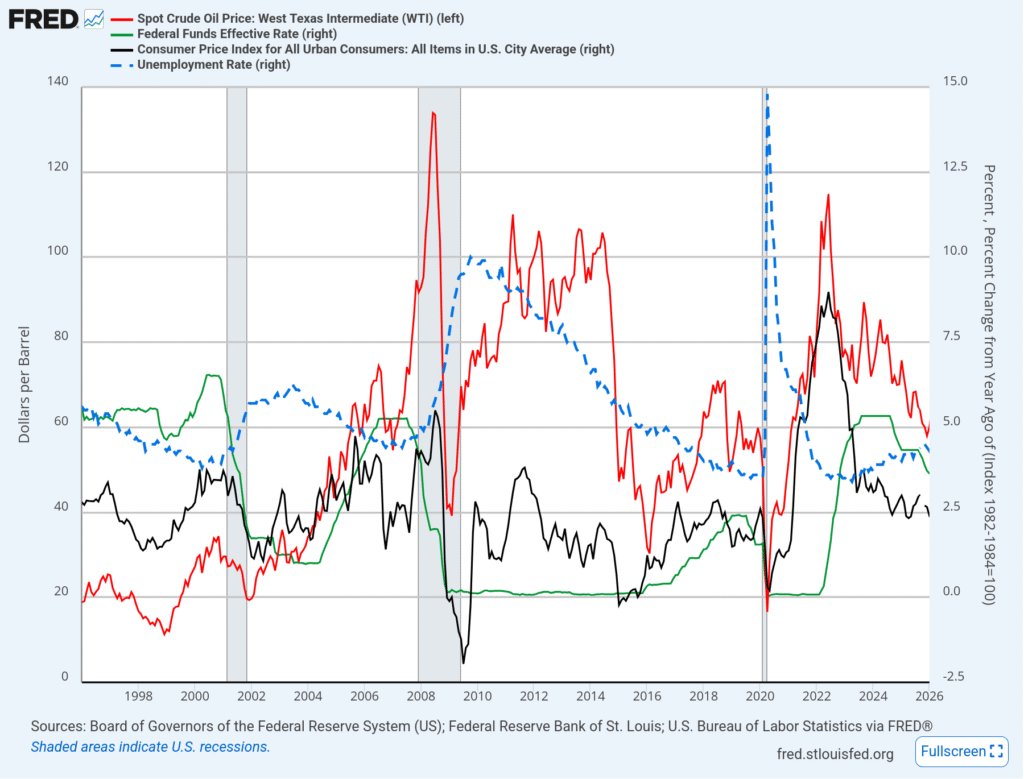
Looking into the most recent macroeconomic trends and indicators, we see a confluence of factors, including higher interest rates and low unemployment in the past years, which typically correspond with the top of a credit and market cycle.
Taking this information together with the recent oil price spikes due to the Middle East conflict between the US and Iran in March 2026, we would be tempted to predict an imminent recession.
Subscribe below to be notified each time we publish new material!