A deeper look beyond conventional central‑bank narratives
Conventional macroeconomics claims that inflation expectations can become self‑fulfilling, generating inflation even without monetary expansion. But real‑world evidence shows expectations alone cannot sustain multi‑year inflationary episodes.
1. Do Inflation Expectations Really Create Inflation?
Many mainstream explanations suggest that inflation expectations can create a self‑reinforcing cycle: if people expect prices to rise, firms increase prices, workers demand higher wages, and inflation becomes a self‑fulfilling prophecy.
This view is only partly true.
Behavioral research shows households rely on price heuristics — if salient prices rise, they assume broad inflation must rise. This can generate short-term price and wage adjustments, but these effects decay quickly without monetary or credit support.
Long-run inflationary episodes, like the 1960s–1970s, required monetary accommodation. Inflation expectations amplified inflation only because policy remained passive and allowed money and credit to expand.
Similarly, IMF research notes that expectations can drive near-term pricing behavior, but sustained inflation depends on a monetary environment that does not counteract it.
Conclusion
Expectations matter — but only as an amplifier, not a sustained cause of inflation.
References (URLs)
Federal Reserve: https://www.federalreserve.gov/econres/feds/files/2020035pap.pdf
IMF: https://www.imf.org/-/media/Files/Publications/WEO/2023/October/English/ch2.ashx
Behavioral expectations: https://fastercapital.com/content/Inflation-Expectations–Expecting-the-Inevitable–How-Inflation-Expectations-Become-Self-Fulfilling-Prophecies.html
2. Why Expectations Cannot Sustain Multi‑Year Inflation
For inflation to persist, economies require:
- expanding money supply
- loose credit conditions
- fiscal stimulus or deficit monetization
- a central bank unwilling to tighten policy
Expectations supply psychological pressure, not purchasing power.
BIS research shows households frequently maintain high inflation expectations even when actual inflation is falling, due to tight monetary policy reducing demand.
The NBER also finds that unanchored expectations only amplify inflation when combined with supply shocks and particular monetary frameworks. They cannot independently sustain inflation.
Conclusion
Without monetary fuel, expectations burn out.
References (URLs)
BIS: https://www.bis.org/publ/bisbull104.pdf
NBER: https://www.nber.org/system/files/working_papers/w33858/w33858.pdf
3. A Clear Definition of the Phillips Curve
The Phillips Curve traditionally posits an inverse relationship between unemployment (pi) and inflation (u):
Modern versions incorporate expectations:
Where:

is the expected inflation
is the NAIRU (non‑accelerating inflation rate of unemployment)
This forms the basis for many central bank forecasting models, despite severe empirical failures over recent decades.
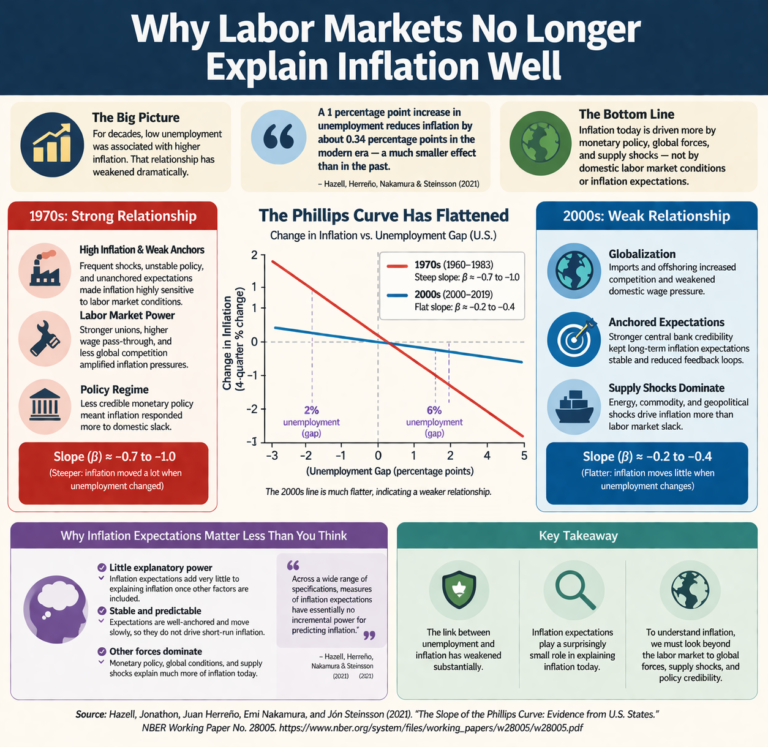
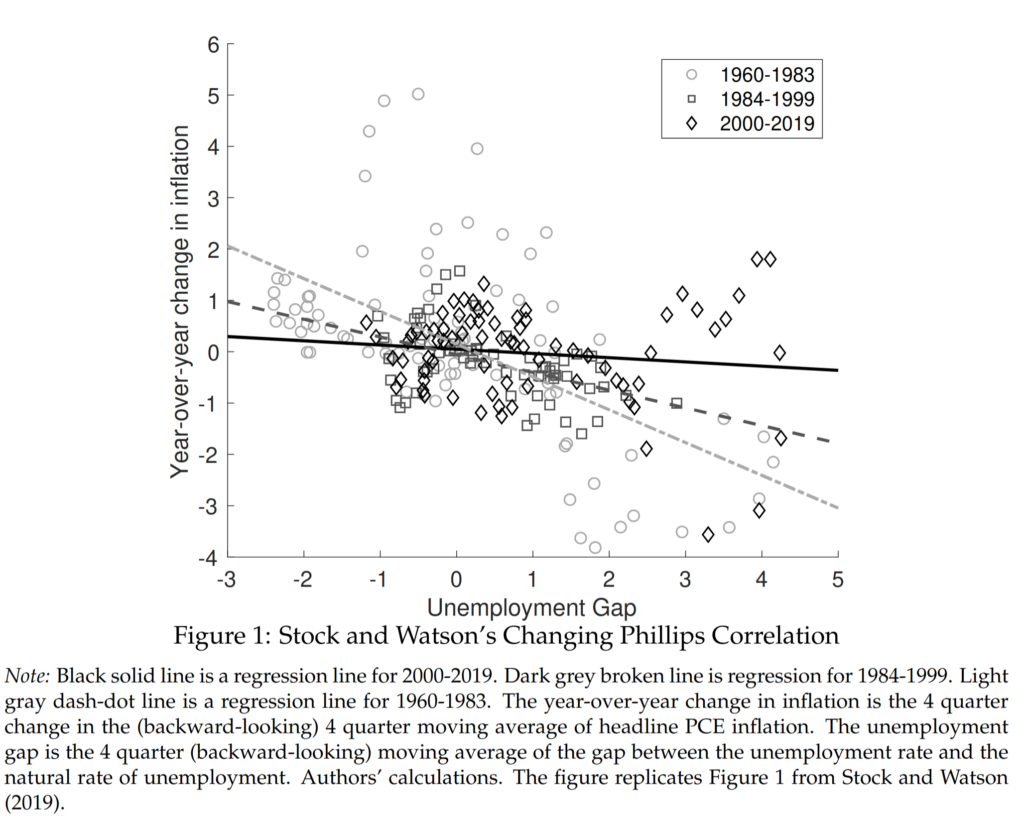
Empirical evidence strongly supports the view that the Phillips Curve has weakened over time. The figure below, based on National Bureau of Economic Research research by James Stock and Mark Watson, shows the relationship between the unemployment gap and changes in inflation across different periods:
- Period 1960-1983 (gray dash-dot line), with the highest slope,
- Period 1984-1999 (dashed line), with an intermediate slope,
- Period 2000-2019 (black solid line), with near zero slope – which means there is very little correlation between the change in inflation and the unemployment gap.
In the 1960–1983 period, the relationship was relatively steep, indicating that labor market conditions had a strong impact on inflation dynamics. However, the slope declines significantly in the 1984–1999 period and becomes nearly flat in the 2000–2019 period.
This suggests that unemployment has become a much weaker predictor of inflation, consistent with the broader evidence that inflation dynamics are increasingly driven by monetary policy, expectations anchoring, and supply-side factors rather than labor market slack alone.
Source of Fig. 1, and full paper:
The Slope of the Phillips Curve: Evidence from U.S. States
Jonathon Hazell, Juan Herreño, Emi Nakamura, and Jón Steinsson
NBER Working Paper No. 28005
October 2020, Revised May 2021
JEL No. E30
https://www.nber.org/system/files/working_papers/w28005/w28005.pdf
4. Why the Phillips Curve Fails Today (Deep Critique + Real Examples)
Other recent empirical research suggests that the Phillips Curve has not disappeared, but has weakened significantly over time. Globalization, improved monetary policy credibility, and anchored inflation expectations have reduced the sensitivity of inflation to unemployment. As a result, labor market conditions alone are no longer sufficient to explain inflation dynamics, reinforcing the importance of monetary policy, supply shocks, and financial conditions.
https://doi.org/10.1016/j.rie.2024.100987
✅ 4.1 Expectations Are Not Rational
Real-world expectations are biased, backward-looking, and prone to heuristics.
BIS evidence shows expectations remain high even when actual inflation falls.
The CBO shows firms and households are poorly informed about inflation and monetary policy, undermining the expectations channel.
✅ 4.2 Near-term expectations matter more than unemployment
IMF research finds short-term expectations, not unemployment, increasingly drive inflation dynamics.
✅ 4.3 Information frictions break the mechanism
Firms do not adjust prices based on aggregate inflation forecasts.
✅ 4.4 Real-world failures
Case 1 — 2010s: Low unemployment, low inflation
Inflation stayed below target despite historically low unemployment.
Case 2 — 2021–2022: Inflation surge without falling unemployment
Inflation was driven by supply shocks and stimulus, not labor markets.
Case 3 — 2023–2024: Disinflation despite high expectations
Inflation fell while expectations stayed high; tight monetary policy was decisive.
✅ Conclusion
The Phillips Curve fails because:
- expectations are inaccurate
- slack no longer predicts inflation
- supply shocks dominate
- monetary policy overwhelms labor‑market effects
References (URLs)
IMF: https://www.imf.org/-/media/Files/Publications/WEO/2023/October/English/ch2.ashx
BIS: https://www.bis.org/publ/bisbull104.pdf
CBO: https://www.cbo.gov/system/files/2022-03/57398-Inflation.pdf
NBER: https://www.nber.org/system/files/working_papers/w33858/w33858.pdf
5. How Central Banks Respond to This Critique
✅ 5.1 “It’s not dead — it’s flattened.”
The Cleveland Fed argues the curve has weakened but still exists.
✅ 5.2 Nonlinearity and structural breaks
The Fed emphasizes nonlinear behavior: the curve steepens only in extremely tight labor markets.
✅ 5.3 Anchored expectations flatten the curve
Adopting numerical targets (like 2%) helps anchor expectations and flatten the curve.
U.S. expectations remained anchored even through the pandemic.
✅ 5.4 The curve is still used — but as one input
Powell (FED Chair) acknowledges the curve weakened but insists it still offers useful directional information.
✅ 5.5 Shift toward supply-shock and sectoral models
Central banks increasingly incorporate sectoral and regional dynamics into forecasting.
References (URLs)
Cleveland Fed: https://www.clevelandfed.org/publications/economic-commentary/2019/ec-201911-flattening-phillips-curve
Fed nonlinear curve: https://www.federalreserve.gov/econres/notes/feds-notes/nonlinear-phillips-curves-20240904.html
Kansas City Fed: https://www.kansascityfed.org/documents/8532/rwp20-11bundicksmith.pdf
Fed in Print version: https://www.kansascityfed.org/documents/5637/rwp20_11_DidFederalReserveBreakPhillpsCurveTheoryEvidenceAnchoringInflationExpectation.pdf
MIT Press version: https://direct.mit.edu/rest/article/107/5/1310/116978/Did-the-Federal-Reserve-Break-the-Phillips-Curve
Cato Powell commentary: https://www.cato.org/cato-journal/winter-2020/phillips-curve-poor-guide-monetary-policy
6. Modern Monetary Theory vs. Orthodox Views
Orthodox view:
Inflation is driven by expectations, output gaps, monetary policy, and supply shocks.
MMT view:
Inflation occurs when fiscal spending exceeds real resource capacity, not when expectations rise.
Expectations matter only insofar as they influence spending — which requires fiscal action or credit expansion.
References (URLs)
NBER: https://www.nber.org/system/files/working_papers/w33858/w33858.pdf
IMF: https://www.imf.org/-/media/Files/Publications/WEO/2023/October/English/ch2.ashx
7. Empirical Cases Where Expectations Failed to Generate Inflation
- 2023–2024: expectations high, inflation fell due to tight money.
- 2010s: expectations overshot while inflation remained low amid deleveraging.
- Early 1980s: expectations remained high, inflation collapsed after Volcker’s tightening.
References (URLs)
BIS: https://www.bis.org/publ/bisbull104.pdf
IMF: https://www.imf.org/-/media/Files/Publications/WEO/2023/October/English/ch2.ashx
Federal Reserve: https://www.federalreserve.gov/econres/feds/files/2020035pap.pdf
✅ Final Thoughts: Expectations Are Not a Cause
Persistent inflation requires:
- monetary expansion
- fiscal stimulus
- credit growth
The Phillips Curve’s failures reinforce this point: inflation today depends far more on policy regimes, supply shocks, and financial conditions than on unemployment or expectations.