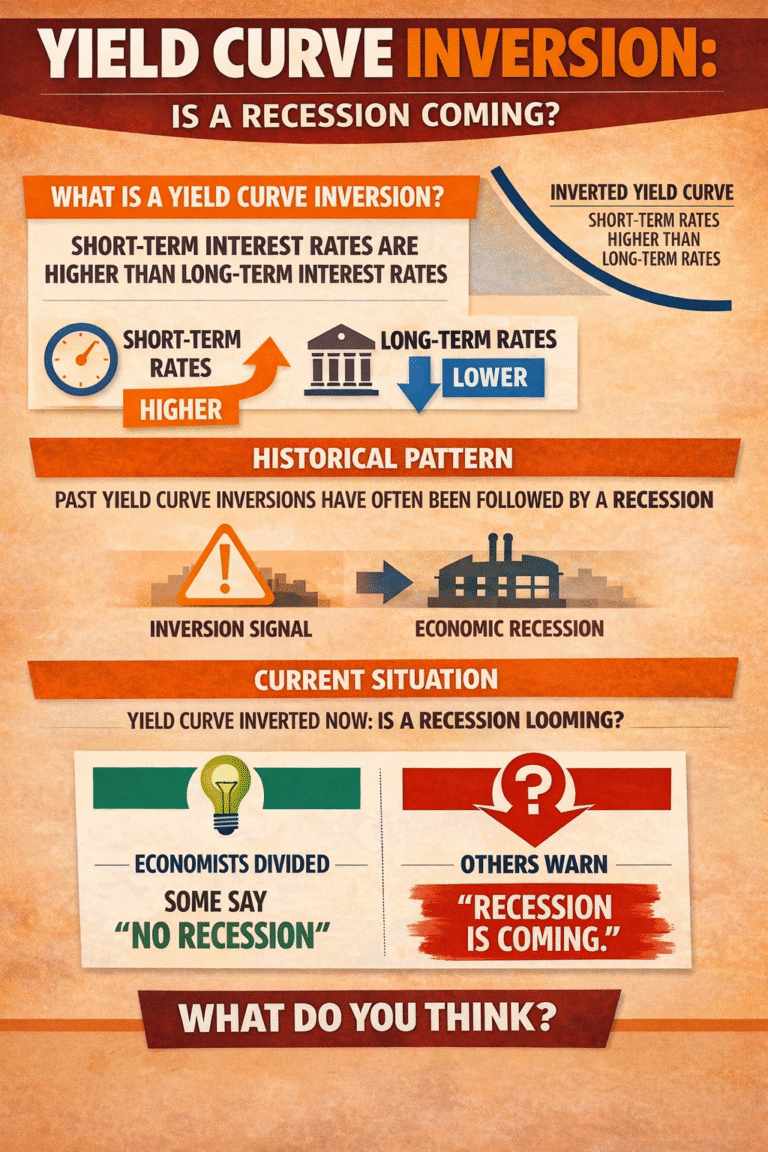
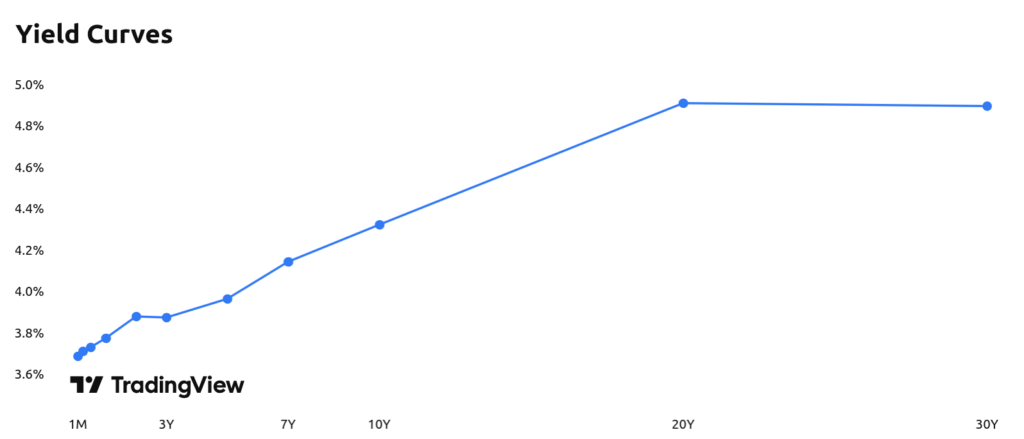
What is the yield curve?
The yield curve shows the relationship between interest rates (yields) and time to maturity for government bonds—typically U.S. Treasuries.
Under normal conditions:
- Long-term bonds (10-year) have higher yields
- Short-term bonds (2-year) have lower yields
This reflects:
- inflation expectations
- economic growth expectations
- risk premium over time
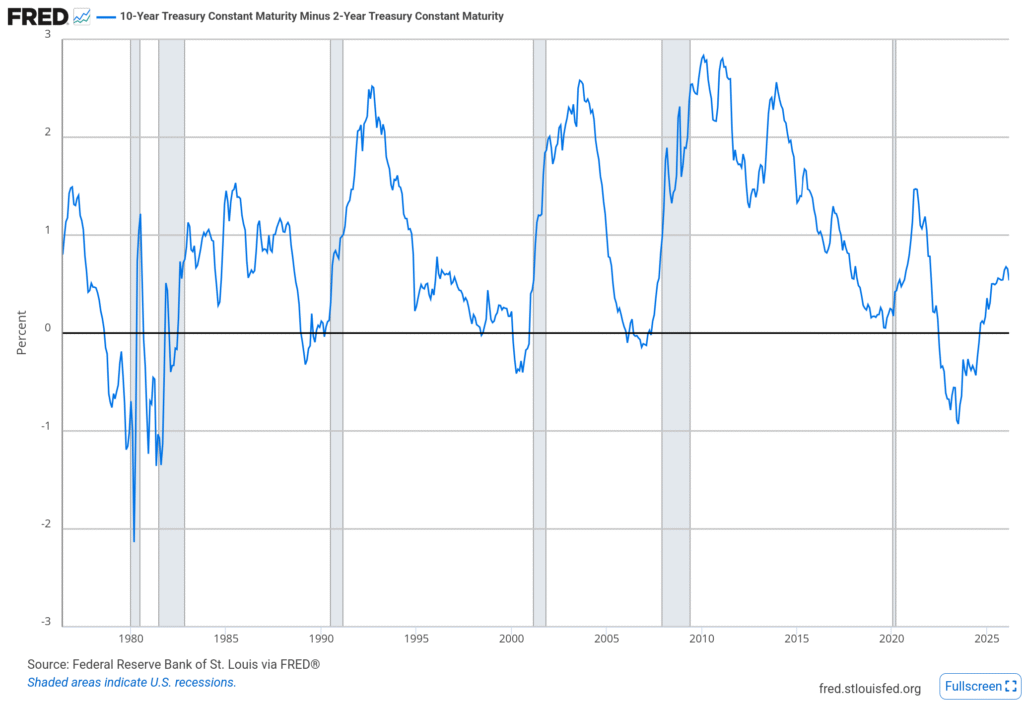
What is a yield curve inversion?
A yield curve inversion occurs when:
- short-term rates > long-term rates
In practice, the most commonly watched measure is:
- 2-year vs 10-year Treasury spread
👉 When this spread turns negative, the curve is inverted. Check the plot below!
Why does the yield curve invert?
There are two forces at play:
1. Central banks raise short-term rates
To fight inflation, central banks increase policy rates.
→ Short-term yields rise quickly
2. Markets expect slower growth ahead
Investors anticipate:
- weaker growth
- lower future inflation
- eventual rate cuts
→ Long-term yields stop rising or fall
👉 The result:
Short-term rates > long-term rates
→ inversion
Why does it predict recessions?
An inverted yield curve signals that:
- monetary policy is tight
- financial conditions are restrictive
- markets expect a slowdown
This leads to:
- reduced lending profitability for banks
- tighter credit conditions
- slower investment and consumption
👉 Which eventually leads to a recession.
Historical examples of yield curve inversions
Here are the most important recent cycles:
🔹 1989 Inversion → 1990 Recession
- Inversion: late 1988 – early 1989
- Recession: July 1990 – March 1991
👉 Lag: ~12–18 months
🔹 2000 Inversion → Dot-com Recession
- Inversion: 2000
- Recession: March 2001 – November 2001
👉 Trigger: tech bubble burst
🔹 2006–2007 Inversion → Global Financial Crisis
- Inversion: mid-2006 → mid-2007
- Recession: December 2007 – June 2009
👉 One of the clearest signals in modern history
🔹 2019 Inversion → Pandemic Recession
- Inversion: August 2019
- Recession: February 2020 – April 2020
👉 Special case: shock-driven recession (COVID), but signal still valid
🔹 2022–2024 Inversion → ? (ongoing cycle)
- Inversion began: mid-2022
- Deepest inversion: 2023–2024
👉 Still being debated:
- delayed recession?
- or structural changes?
What about “uninversion”?
This is where it gets really interesting—and often misunderstood.
What is uninversion?
The yield curve returns to normal shape:
- long-term rates > short-term rates again
But this usually happens because:
- central banks start cutting rates
- short-term yields fall quickly
Why uninversion matters more than inversion
Historically:
👉 Recessions often begin after the curve steepens again, not at the moment of inversion.
Examples:
- 2000: curve steepened → recession followed
- 2007: steepening preceded the crisis
- 2020: steepening before COVID recession
“The inversion is the warning. The steepening is often the trigger.”
Limitations of the yield curve
No indicator is perfect. Check here a related article on recession indicators.
1. Timing is uncertain
- Lag can vary from 6 to 24 months
2. False signals (rare but possible)
- Some inversions did not lead to immediate recessions
3. Structural changes
- QE, global demand for bonds, and central bank policies may distort signals
How to use it in practice
The yield curve works best when combined with:
- interest rate trends
- credit conditions
- labor market data
Subscribe below to be notified each time we publish new material!