
Introduction — Capital Moves, Until It Doesn’t
Capital flows are the lifeblood of financial markets, yet those flows are never frictionless, as they are shaped not only by expectations, risk, and liquidity, but also by structural constraints embedded within jurisdictions, tax systems, and regulatory frameworks that ultimately determine how freely capital can move across assets, borders, and time horizons.
Confidence in a market, a currency, or a jurisdiction is therefore not simply a function of growth or monetary policy, but rather a function of how predictable, efficient, and unobstructed capital allocation is perceived to be, since investors are not only allocating capital toward returns, but also away from friction.
I. Capital Friction and Market Confidence
At its core, financial friction can be understood as any cost—explicit or implicit—that reduces the efficiency of capital allocation, and while transaction costs and bid-ask spreads are often discussed at the micro level, structural frictions such as taxation, capital controls, and regulatory burdens play a far more significant role in shaping long-term investment behavior and jurisdictional attractiveness.
Transaction-based frictions, such as taxes on trades, directly reduce expected returns and disproportionately penalize strategies that rely on reallocation, rebalancing, or liquidity provision, thereby discouraging active capital movement even when underlying economic signals would justify it.
Regulatory frictions, including reporting obligations and compliance costs, increase the operational burden of investing in certain jurisdictions, effectively acting as a barrier to entry for both individuals and institutions, while fiscal uncertainty—defined as the unpredictability of future tax regimes—can be just as damaging as high taxation itself, since capital is inherently forward-looking and highly sensitive to regime instability.
Finally, monetary and currency-related frictions, such as inflation volatility or capital controls, shape confidence at a higher level, as they influence not only returns but also the ability to repatriate capital, which is ultimately the foundation of international investment.
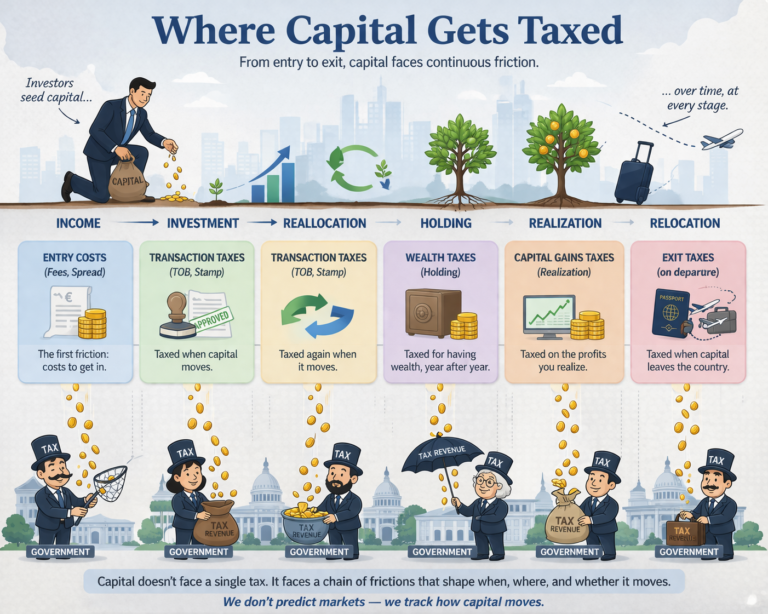
In this context, taxes on financial transactions occupy a unique position, as they are both immediate and cumulative, applying at each step of capital movement rather than at the final realization of gains, thereby compounding their impact over time.
II. The Belgian TOB — Structure, Mechanics, and Intent
The Belgian Tax on Stock Exchange Transactions (TOB) represents a clear example of transaction-based capital friction, as it applies a tax to the act of trading itself, rather than to the outcome of the investment, meaning that it is levied regardless of whether a trade results in a profit or a loss. (auryth.ai)
In practical terms, the TOB is calculated as a percentage of the transaction value, with rates depending on the type of financial instrument, typically ranging from 0.12% to 1.32%, and applying to both purchases and sales in many cases, thereby introducing a round-trip cost that compounds over time. (tobelgium.com)
For instance, standard equities are taxed at approximately 0.35% per transaction, while ETFs may be taxed at either 0.12% or 1.32% depending on their structure and registration status, with caps applied per transaction but rarely binding for most retail portfolios. (bux.com)
Crucially, the tax is triggered at the moment of execution and is often withheld automatically by Belgian brokers, although investors using foreign intermediaries must calculate, declare, and pay the tax themselves, typically on a monthly basis, with a deadline set at the end of the second month following the transaction. (tob.tax)
From a legal and operational standpoint, the TOB applies broadly to Belgian residents regardless of whether the underlying assets are domestic or foreign, thereby reinforcing the idea that the tax is attached to the investor’s jurisdiction, not the asset itself. (curvo.eu)
III. A Practical Example — The Cost of Movement
To illustrate the impact of transaction-based taxation, consider a hypothetical investor allocating €10,000 into different instruments in Belgium, assuming no price change in order to isolate the effect of taxation alone.
If the investor purchases and later sells a standard equity subject to a 0.35% TOB, the round-trip tax cost amounts to approximately 0.70%, or €70, incurred regardless of performance and effectively acting as a negative return that must be overcome before any profit is realized. In the case of an ETF taxed at 0.12%, the same round-trip transaction results in a cost of roughly €24, while ETFs taxed at the higher 1.32% rate would generate a round-trip cost of 2.64%, or €264 on a €10,000 position.
Although these amounts may appear modest in isolation, their cumulative effect over time—particularly in strategies involving periodic rebalancing or tactical allocation—can materially erode returns, reinforcing the idea that the TOB is not merely a marginal cost, but a structural drag on capital mobility.
IV. The TOB as a Tax on Capital Movement
Unlike capital gains taxes, which apply only when value is created and realized, the TOB applies whenever capital is reallocated, making it structurally equivalent to a tax on movement itself, rather than on outcomes.
This distinction is critical, because it alters investor behavior in subtle but powerful ways, introducing a cost to any form of portfolio adjustment, whether driven by new information, risk management, or liquidity needs, effectively encouraging inertia and penalizing adaptability.
Over time, this creates a bias toward lower portfolio turnover, longer holding periods even when suboptimal, and reduced participation in tactical strategies. More importantly, the compounding nature of the tax means that strategies involving frequent rebalancing or diversification across instruments become structurally less attractive, even if they would otherwise improve risk-adjusted returns.
In this sense, the TOB does not merely tax transactions—it reshapes the behavioral architecture of investors, reducing the velocity of capital and thereby introducing a form of “financial viscosity” into the system.
V. Global Comparisons — Transaction Taxes and Capital Mobility Across Jurisdictions
Belgium’s TOB occupies a specific niche of transaction-based taxation, but it is far from the only jurisdiction imposing formal levies on capital movements. Across Europe and beyond, countries have adopted a variety of regimes — ranging from broad financial transaction taxes and stamp duties to very light or negligible levies — each with distinct implications for capital mobility, market participation, and investor behavior.
1. United Kingdom — Stamp Duty Reserve Tax (~0.50%)
The UK applies a 0.50% SDRT on electronically settled share purchases, with stamp duty on paper transfers where relevant. This levy reduces the effective return on entering positions in UK equities and discourages frequent trading or cross-border investments. (gov.uk)
2. France — Financial Transaction Tax (~0.40%)
France’s Financial Transaction Tax (FTT) applies 0.40% on acquisitions of certain French-listed stocks meeting specific criteria, while sales are generally exempt. It functions as a transaction-based friction on entry into domestic equities. (keytradebank.be)
3. Other European Examples
Other EU countries demonstrate significant variation: Ireland levies ~1.0%, Greece ~0.2%, Spain ~0.2% on purchase transactions, while Switzerland applies 0.15–0.3% depending on security type and whether the dealer is domestic. (europarl.europa.eu)
4. High Capital Gains and Wealth Taxes
Some countries impose high capital gains taxes or wealth taxes, which while not directly taxing transactions, reduce the expected after-tax return on financial assets. Belgium’s new regime taxes certain financial assets at 10% beyond exemption thresholds, France and Spain can reach ~30% depending on income bands. (tob.tax)
5. Low-Friction Jurisdictions
Jurisdictions such as Cyprus, UAE, and Singapore have near-zero financial transaction taxes and limited capital gains levies, effectively eliminating structural friction on capital movement and making them highly attractive for mobile investors. (europarl.europa.eu)
6. Lessons from Sweden
Sweden’s 1980s financial transaction tax, which drastically reduced trading volumes and drove market activity to other jurisdictions, serves as a cautionary tale of excessive friction undermining both liquidity and tax revenues. (Umlauf, 1993)
VI. Tax Panorama Around the World
| Country | Transaction Tax (Stocks) | Capital Gains Tax | Dividend Tax | Wealth Tax |
|---|---|---|---|---|
| Belgium | 0.12%–1.32% (TOB) | ~0% historically → ~10% (new regime above threshold) | 30% | No general wealth tax |
| United Kingdom | 0.50% (Stamp Duty / SDRT) | 18–24% | 8.75–39.35% | None |
| France | 0.40% (FTT) | ~30% | ~30% | Yes (real estate wealth tax) |
| Germany | None | ~26.4% | ~26.4% | None |
| Netherlands | None | ~0% (deemed return system ~1–2%) | ~15% | Yes (Box 3 wealth tax) |
| Spain | ~0.20% (FTT) | 19–28% | 19–28% | Yes |
| Italy | ~0.10% (FTT domestic shares) | 26% | 26% | None |
| Switzerland | 0.15–0.30% | 0% (private investors) | ~35% (with refunds) | Yes (cantonal) |
| Ireland | 1.0% (Stamp Duty) | 33% | 25% | None |
| Portugal | None | 28% | 28% | None |
| Austria | None | 27.5% | 27.5% | None |
| Denmark | None | up to ~42% | up to ~42% | None |
| Norway | None | up to ~37.8% | ~37.8% | Yes |
| Sweden | None (post-1990 repeal) | ~30% | ~30% | None |
| Greece | ~0.20% | 15% | 5%–15% | None |
| Poland | None | 19% | 19% | None |
| Czech Republic | None | 0–23% (exemptions apply) | 15% | None |
| Cyprus | None | 0–20% (many exemptions) | 0–17% | None |
| Singapore | None | 0% | 0% | None |
| United Arab Emirates | None | 0% | 0% | None |
The dispersion in tax regimes is not a detail — it is a map of where capital is incentivized to move, and where it is quietly discouraged.
Transaction taxes are uneven but meaningful
- Belgium (TOB), UK (0.5%), Ireland (1%) stand out
- Many countries have zero transaction friction
Capital moves where friction is lowest
2. Capital gains taxes dominate globally
- Most developed countries: 20–30% range
- Some exceptions: Belgium (historically), Switzerland, UAE
Important contrast:
- TOB = tax on movement
- CGT = tax on outcome
3. Wealth taxes are geographically concentrated
- France, Spain, Norway, Switzerland, Netherlands
- Mostly European phenomenon
Europe = higher structural capital friction
4. True “low-friction” jurisdictions are rare
- UAE, Singapore, Cyprus (partially)
Capital doesn’t disappear — it relocates.
Back to the example of Belgium: While Belgium does not impose a broad-based wealth tax, it applies a 0.15% annual tax on securities accounts exceeding €1 million, effectively acting as a targeted wealth tax on financial assets.
VII. From Investment to Consumption — The Hidden Shift
Transaction and wealth-based taxes gradually redirect capital away from investment toward consumption, as higher costs reduce the attractiveness of financial markets relative to immediate spending. This can reduce participation, long-term capital accumulation, and ultimately shift resources away from productive investment, highlighting a subtle macroeconomic consequence of seemingly technical tax policy.
VIII. Macro Consequences — Liquidity, Efficiency, and Growth
Cumulatively, transaction-based frictions reduce market liquidity, widen bid-ask spreads, and slow the response of capital to information. Over time, persistent frictions can undermine the competitiveness of financial centers, influence long-term investment, and ultimately shape real economic growth, illustrating that taxes on capital movement are as much about macro allocation as about revenue collection.

📚 Sources and References
Transaction Taxes
- UK Stamp Duty / SDRT:
https://www.gov.uk/tax-buy-shares - France FTT (~0.40%):
https://www.impots.gouv.fr - EU turnover taxes overview:
https://www.europarl.europa.eu/RegData/etudes/STUD/2025/772638/ECTI_STU%282025%29772638_EN.pdf - Belgium TOB rates:
https://tob.tax/en/rates
Capital Gains Taxes
- Global CGT rates (PwC):
https://taxsummaries.pwc.com/quick-charts/capital-gains-tax-cgt-rates
European comparison (Tax Foundation):
https://taxfoundation.org/data/all/eu/capital-gains-tax-rates-europe/
Dividend Taxes
- EU dividend tax comparison:
https://taxfoundation.org/research/all/eu/capital-gains-taxation-eu/
Wealth Taxes
- OECD / Tax Foundation summaries:
https://www.oecd.org/tax/tax-policy/ - Country-specific tax portals (France, Spain, Norway, Switzerland)